Article - Looking at Icing tendencies of NHL teams, players and coaches
This research is the result of a conversation with @RobVollmanNHL and looks at the last couple of NHL season for icing committed by teams, players and coaches.
Purpose
I’m no expert by any means on hockey, but generally speaking an icing is a negative event; icing tires out the team, it allows the opposing team to change their lineup and pick their preferred match-ups, and the face-off following icing is in the defensive zone of the icing team, with a roughly 50% change of regaining possesion of the puck (and thus a 50% chance of giving the puck to your opponent in their attacking zone).
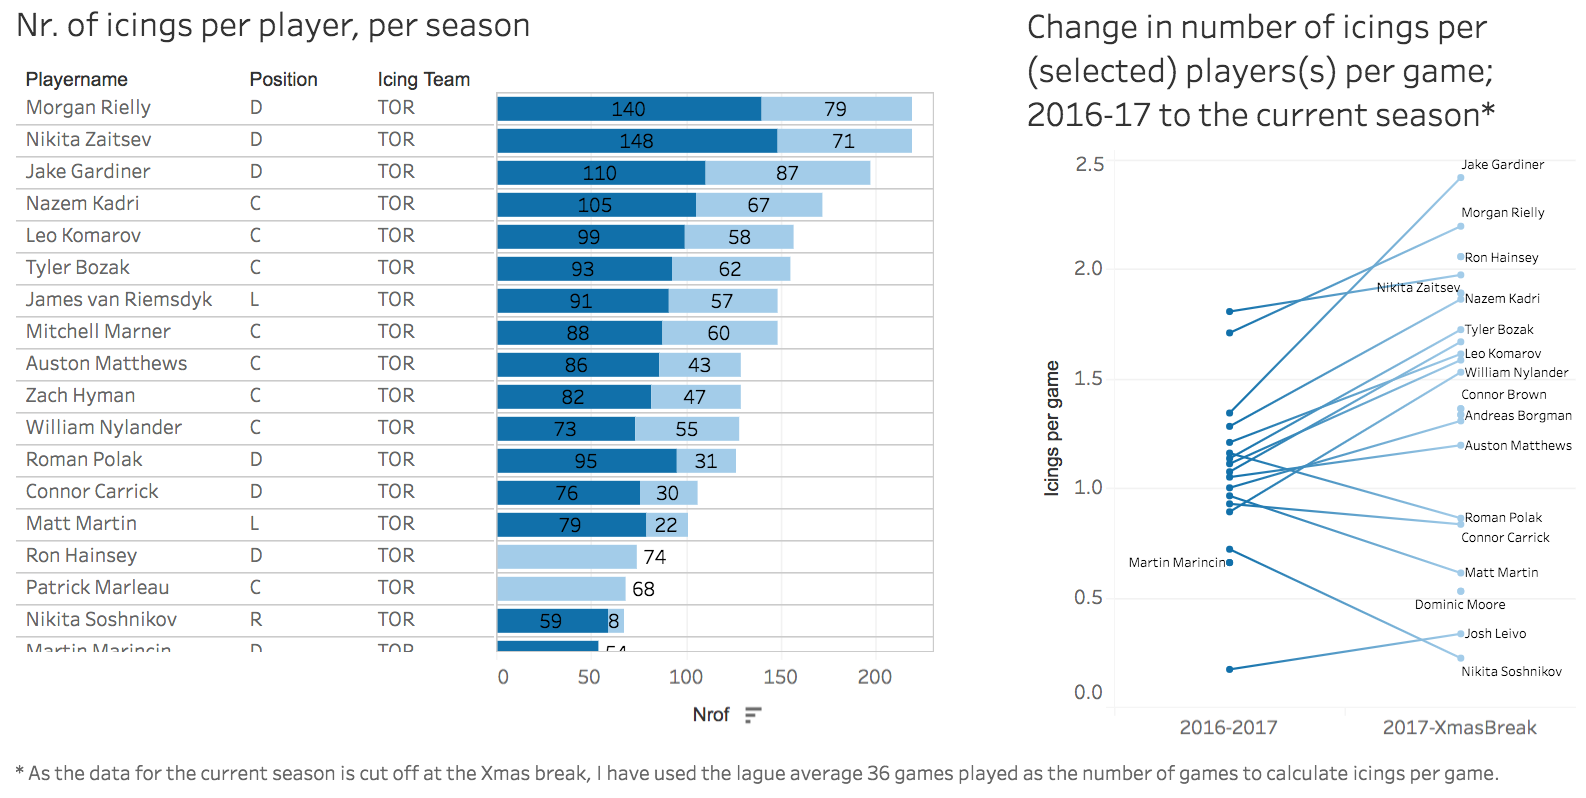
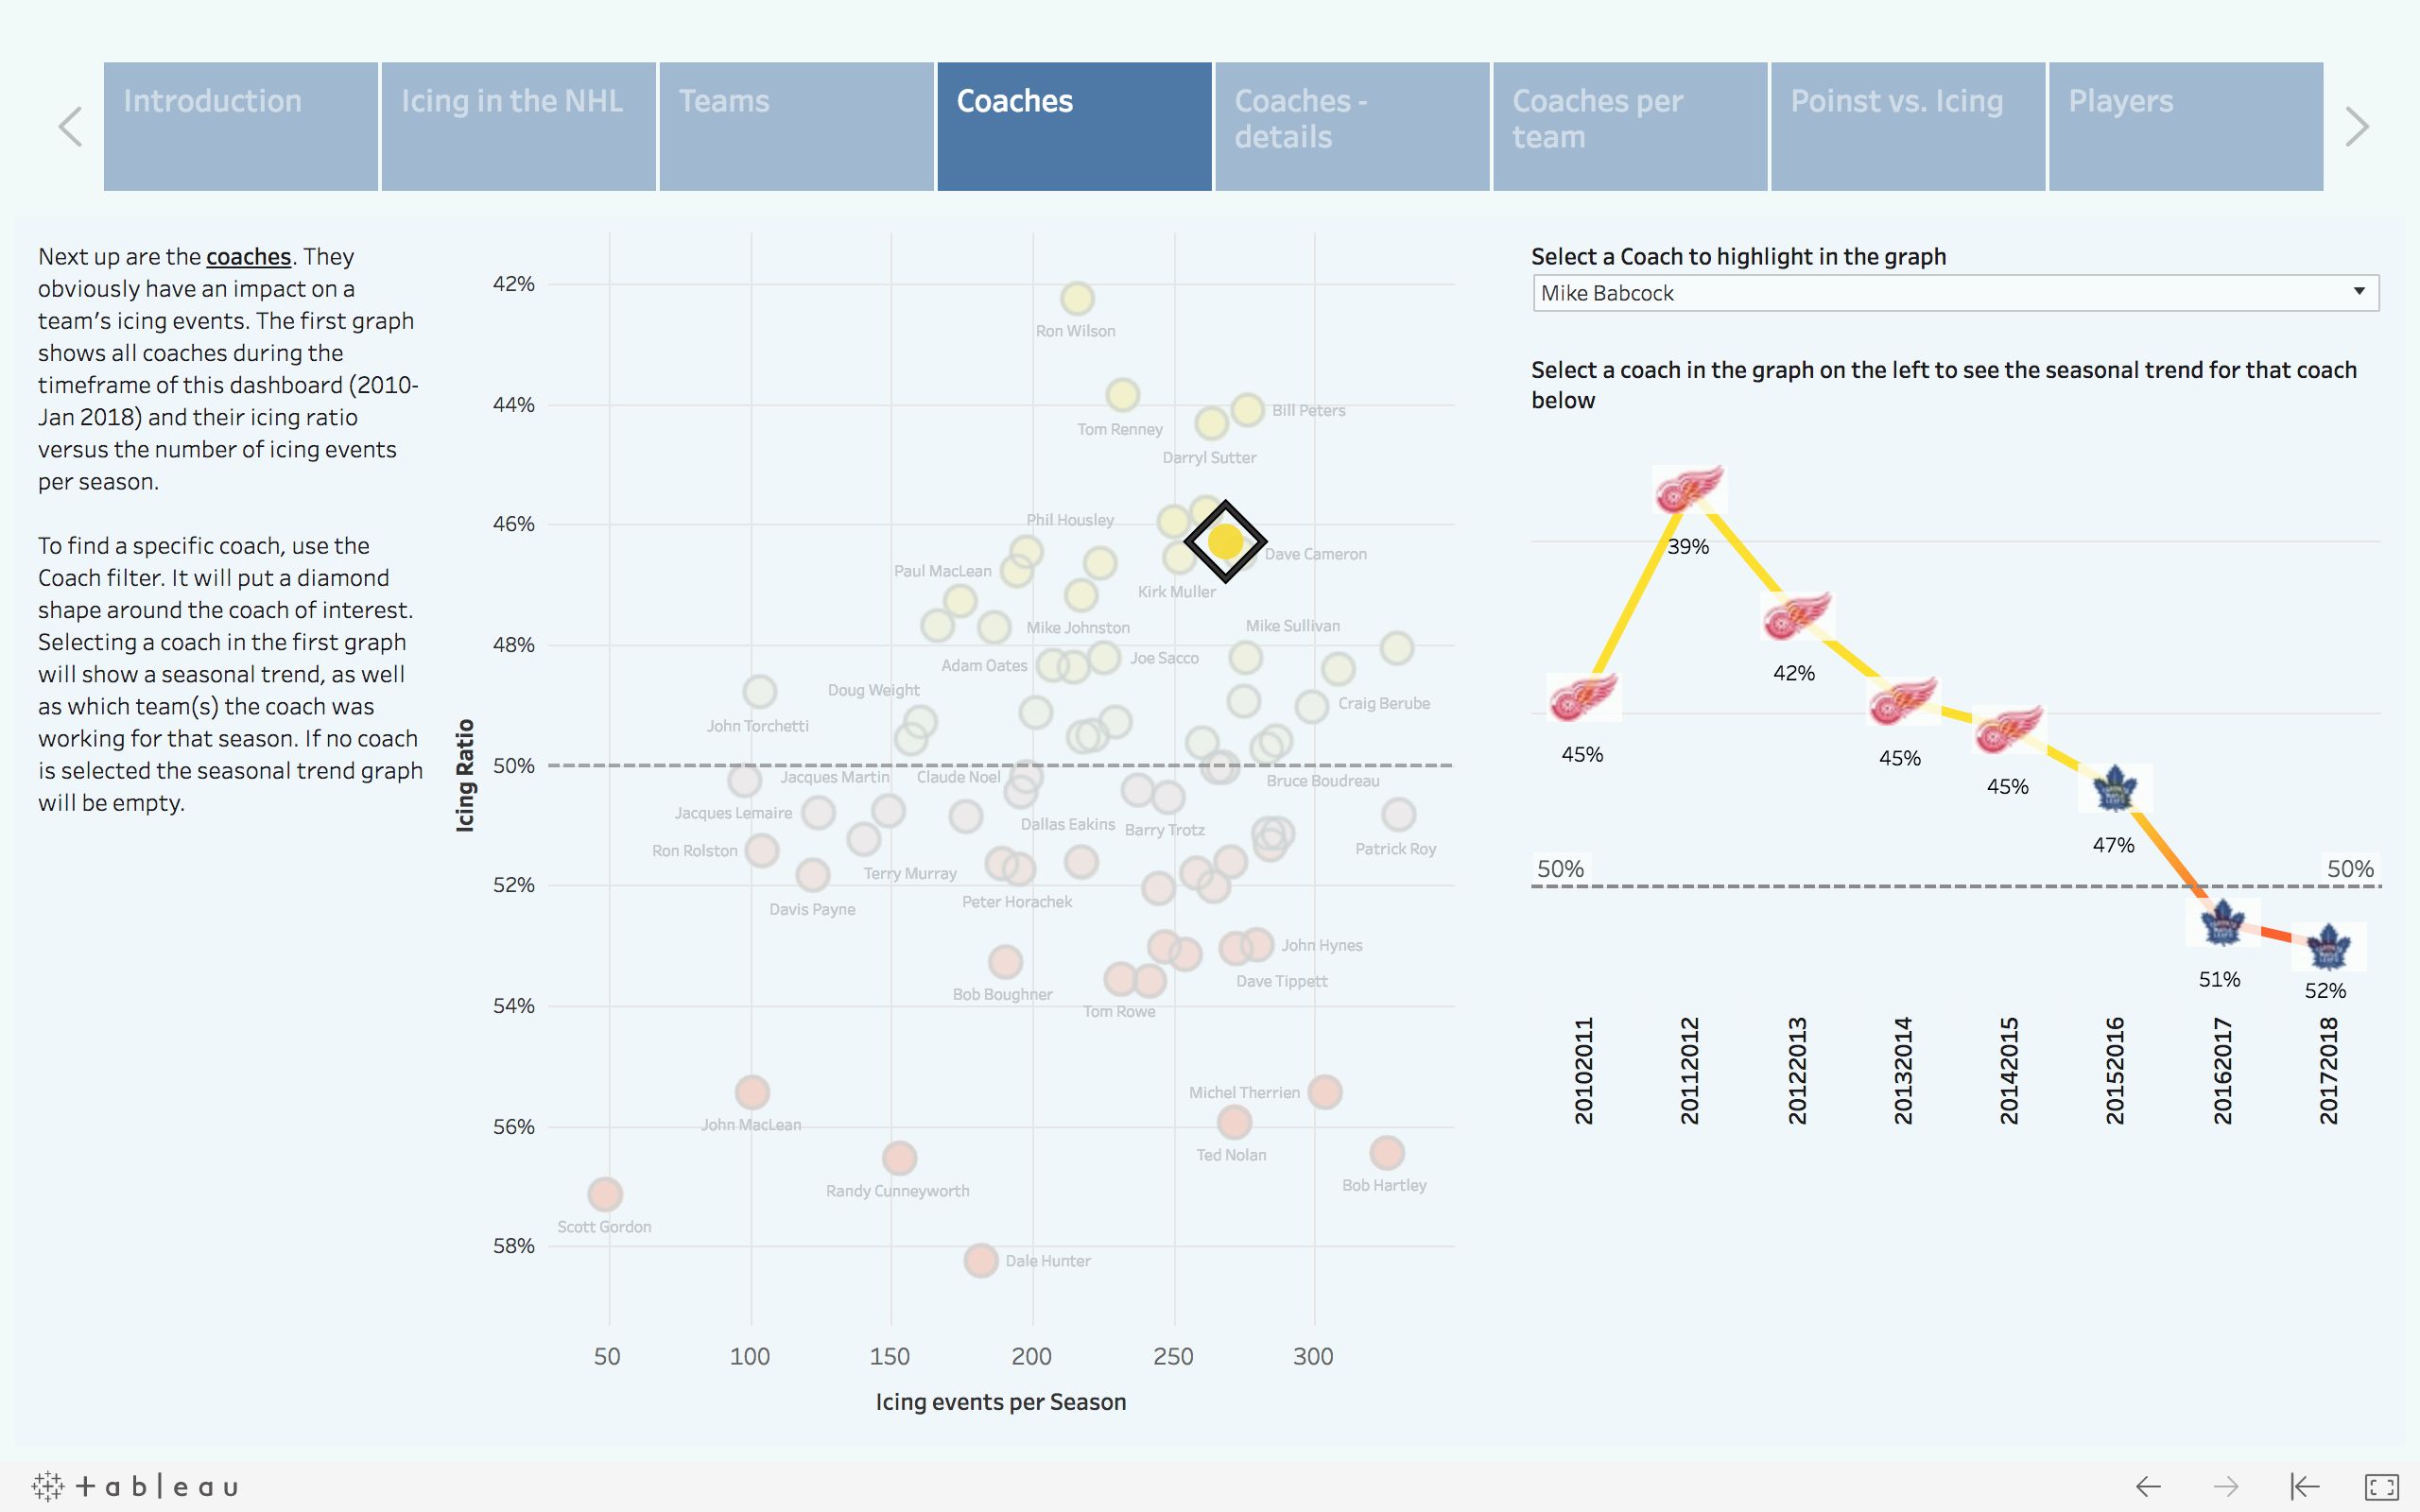
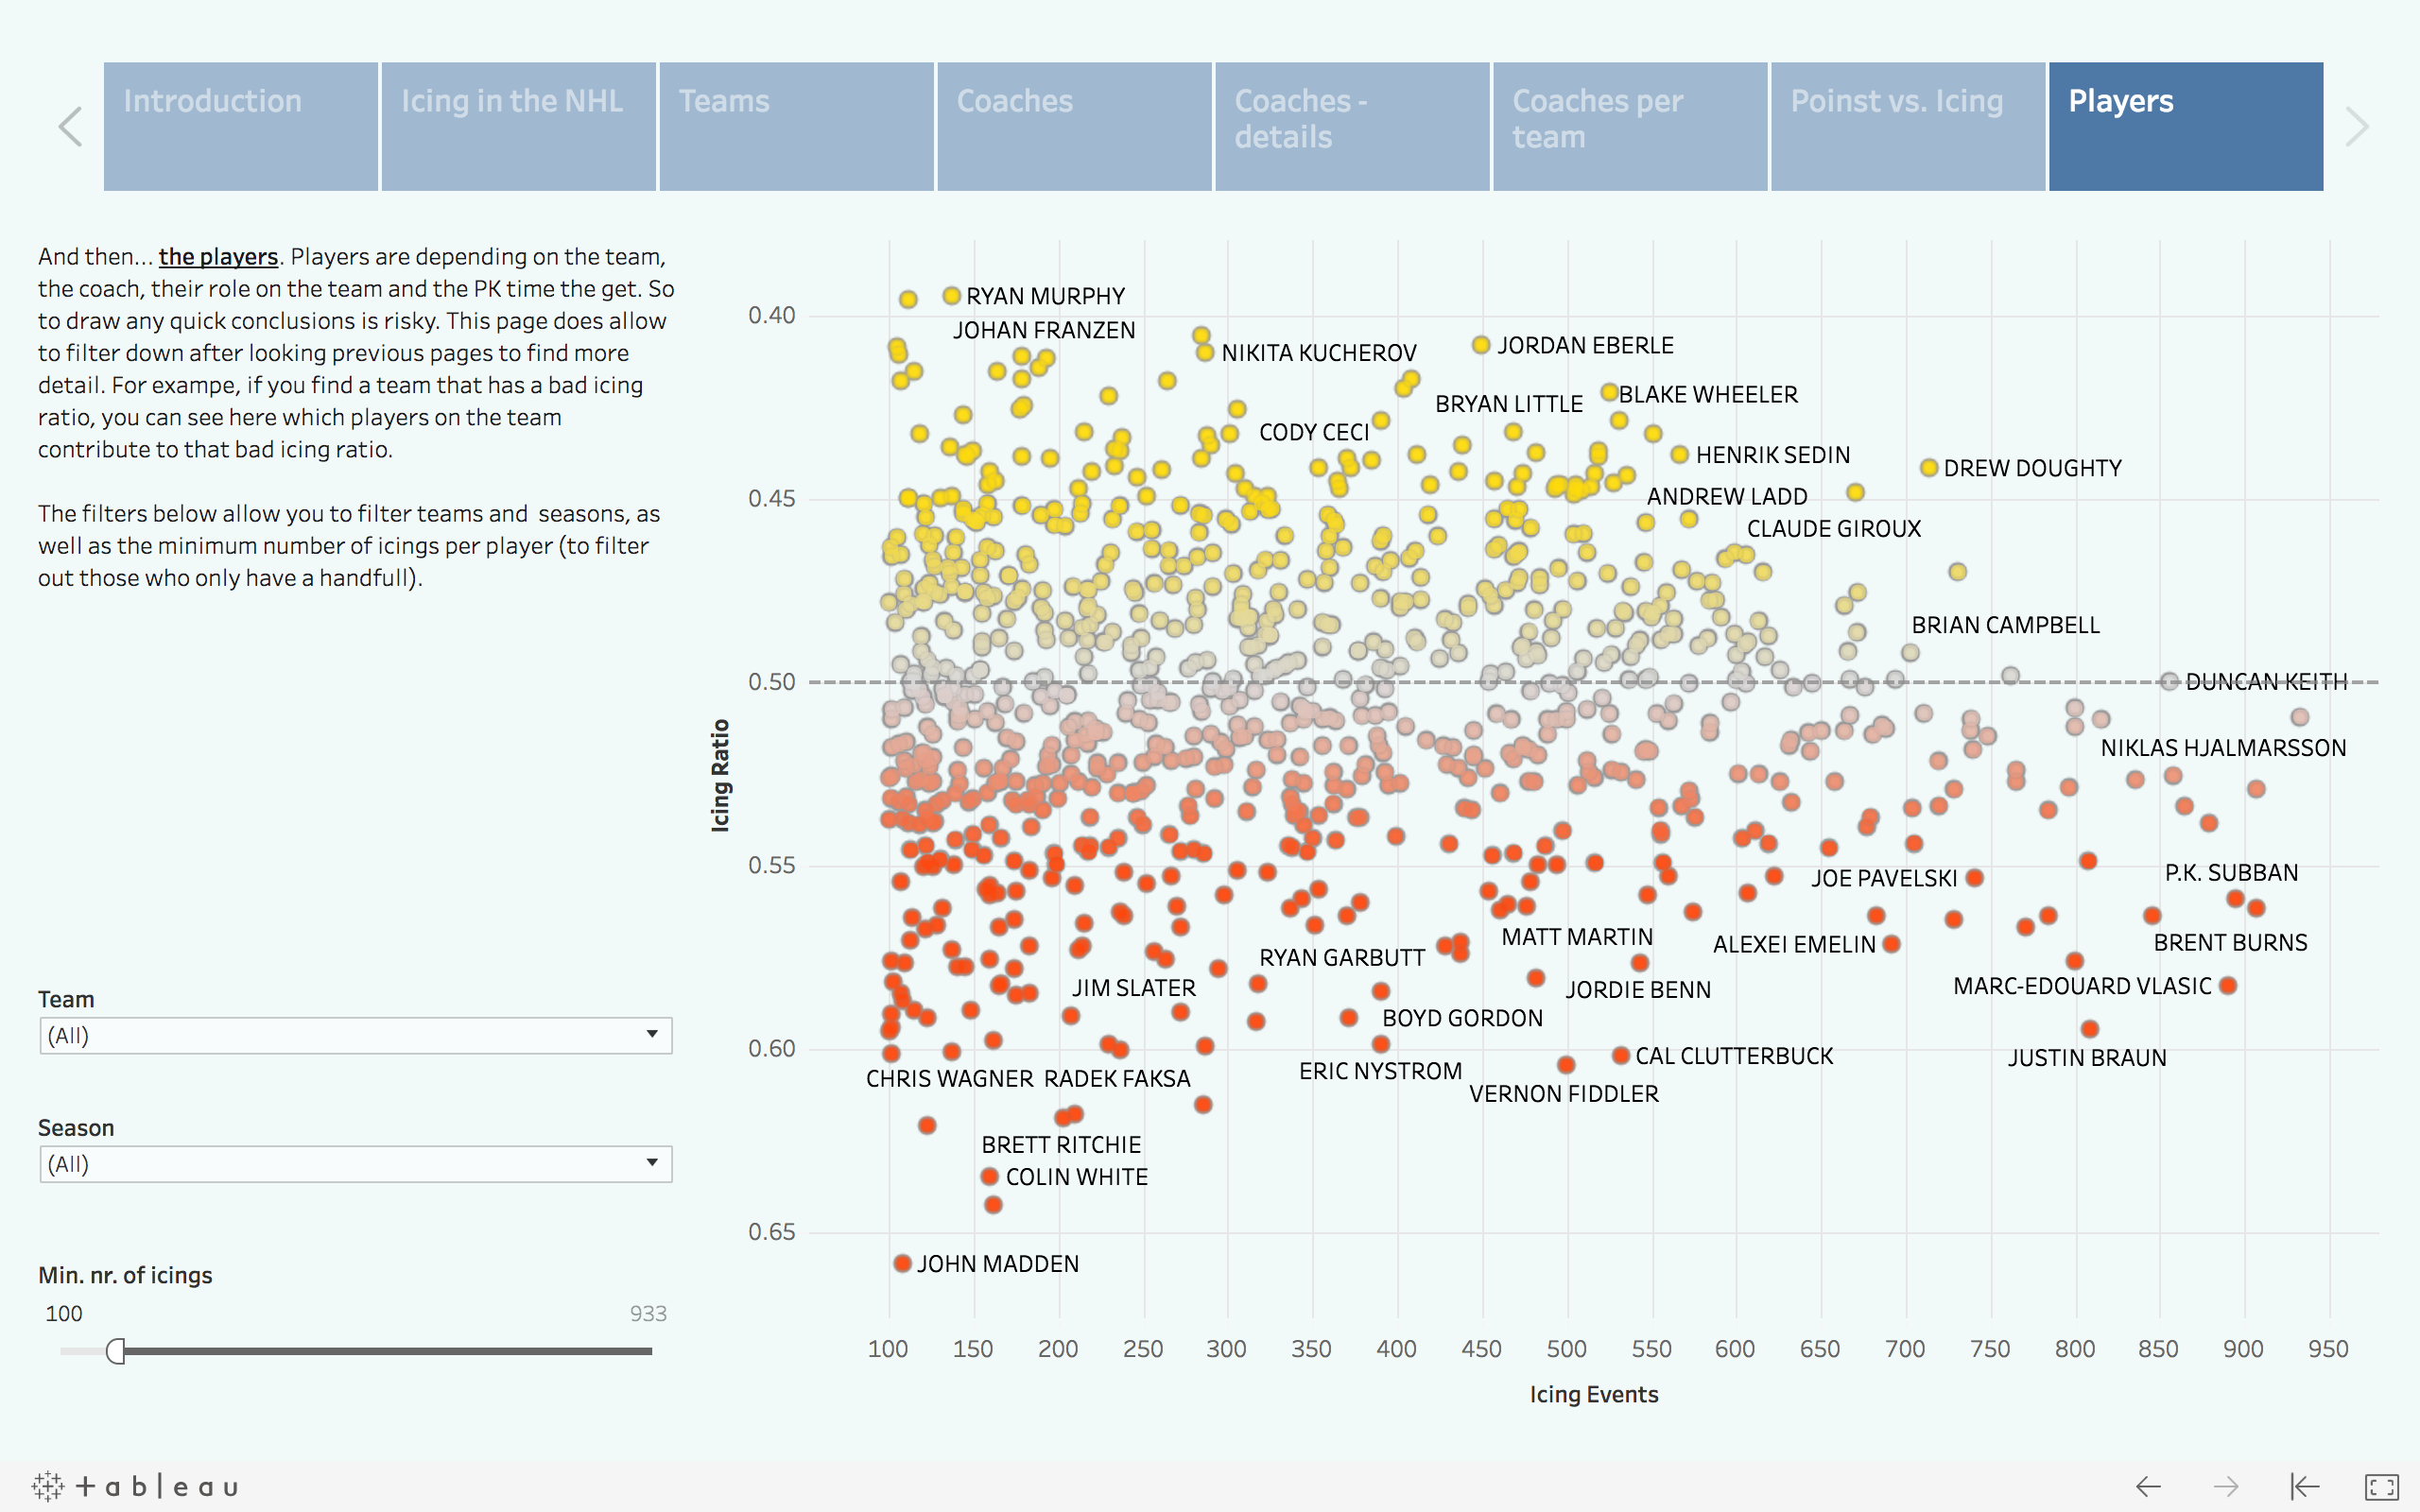
A first step in this research showed me what players iced the puck most, and I then aggregated that data per team. It made me wonder what the influence of the coach was on these icing tendiencies; do some prefer the temporary relief that icing can provide over the potentially negative consequences described above? Does it just come with a certain playing style coaches prefer?
Data
To do this anlysis I needed data for icing events, which team committed the icing, what players were on the ice, and who was coaching that team. For the icing events I use the R package NHLscrapr from A.C. Thomas and Samuel L. Ventura (link) to pull play-by-play data from the NHL’s HTML reports per game (example). This gives me the events per game(-number), the players on ice for each team, the teams, and to a certain degree the team that iced the puck (more to follow below).
Still missing were the coaches of the teams for which I used different R-code that reads the NHL API Life Feed JSON files (example) and pulls both coaches and the game number, which can be linked to the data described above.
The R-code used for the data extraction described above can be found here and here.
NHL Play by Play reports
I should note that to my knowledge it is impossible to determine for every icing which team iced the puck; the icing team can not be determined when the “homezone” field contained other values then “Def” or “Off” (like “”, “Neu” and “Unk”). Checking on a subset of all data I found about 1% of the data contained these values, and were excluded from the research as they could not be assigned to a team or player.
Looking at the icing events in the HTML reports from NHL (example) the extracted file gives me individual on-ice events with information about period, time, event type, a description, and who were on the ice: 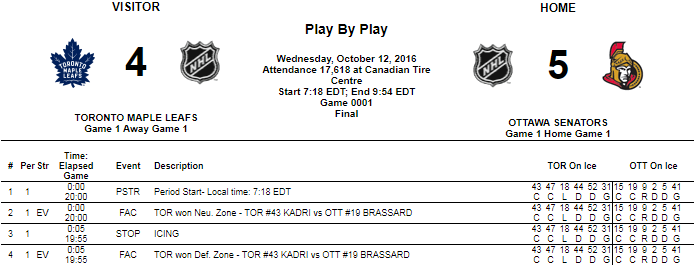
After extracting this file through R and saving it as a csv to open in Excel, we’re looking at the following for the same events:  ZOOM IN…

The actions that need to happen now are:
- filter out the icing events
- identify and assign the icing team and non-icing team
- identify and assign the icing players on the ice (“committing” the icing) and the ones… uhm… “forcing” the icing?
The icing events can be filtered easily through the etype column: etype = “ICING”. It also shows which players were on the ice, and in 99% of the cases the homezone column will specify “Off” or “Def”. Assuming this means the zone for the hometeam where the puck was iced from (as in “passed from before it crossed the red goal line”), we can determine what team (but not which player) iced the puck.
To confirm the assumption let’s look at the image of the report and the underlying data. After 5 seconds in the game an icing happens (report) in homezone “Off” (data). Since this game is in Ottowa (report) the icing is “passed from” Ottowa’s offensive zone (data). The following faceoff is won by Toronto in their defensive zone (report), recorded as “Off” in the homezone column (data). This makes sense, as Toronto iced the puck from their own zone, Ottawa’s offensive zone, leading to a faceoff in Toronto’s defenisive, Ottoawa’s offensive zone.
Still with me?
I checked the lineups for the following faceoffs including ones in the home team’s defensive zone, and the logic is confirmed:
- if the homezone is “Off” for an icing event, the away team iced the puck
- if the homezone is “Def” for an icing event, the home team iced the puck
Leaves us with those icing events where the homezone column has a different value then “Off” or “Def”; looking at the data for the 2016-2017 season I found 10,264 icing events (etpe = “ICING”), with the Homezone values divided as follows:
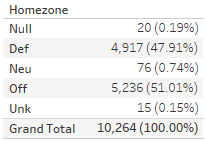
Not a significant number of records, but still. Looking at some individual occurrences the only helpful data in the report and dataset is the next line, which specifies which team won the ensuing faceoff and in what zone that faceoff took place. Unfortunately it seems common that it’s actually not the next record. For example:

So, if we have an icing event, and the homezone is not “Off” nor “Def” we need to look at the first record after the icing event that is a faceoff event. Isn’t this fun!?! But now look at the image again: we have a stopage for icing at 12:12 in the 1st period of this game between Montreal and Buffalo, which - at the same time - is a penalty for Foligno. NHL needs to make more money, so let’s have a TV timeout. Ok, we’re back, with a Faceoff at centre ice (“FAC MTL won Neu. Zone”). Qu’est-ce que Fuck??? Stop messing with my head, Gary B.! Sure, sure, it’s an exception within the 1% of data that is an exception to normal Icing data. No need to start threatening me with moving me to Seatle! :scream: But how a re good-willing amateur analysts supposed to make sense of this?!? Namaste. :pray: I digress…
Data Process details
I downloaded the Play by Play data for seasons 2010-2011 and after, with the current season up to game 707. Now that I have all the data I need, I load it into a Google Cloud Platform Storage bucket. From there I can load the individual files into Google Big Query, where the data is filtered, combined and manipulated to generate the datasets used in Tableau Public to analyse the data and create the eventual visualization:
- I first combined all Play by Play files so get a 2010-2018 file (SQL)
- Adding columns for IcingTeam, IcedTeam, IcingLineup and IcedLineup, and calculate the values (SQL)
- Add SourceGameNR, HomeCaoch and AwayCoach columns, and then coaches to Icing data. Save resulting Table as 3_NHL_PbP_HtmlReports_2010_2018g707_ICINGevents_JOIN_coaches (SQL)
- Add columns IcingCoach and IcedCoach to 3_NHL_PbP_HtmlReports_2010_2018g707_ICINGevents_JOIN_coaches and calculate them (SQL)
- Create a list of all players in the Icing datasets, combined with season and team. (SQL)
- Join Player list with icing data for only players, and players-season-team and save to 6_Players_2010_2018g707_IcingIcedRatio and 6_Players_Season_Team_2010_2018g707_IcingIcedRatio (SQL)
- We’ll do the same for Coaches, creating a lost of Coaches and one combined with season and team: 7_Coaches_Season_Team and 7_Coaches (SQL)
- Now create the join between the coaches list and the Icing data, resulting in 8_Coaches_2010_2018g707_IcingIcedRatio and 8_Coaches_Season_Team_2010_2018g707_IcingIcedRatio (SQL)
Now I have a ll the data I need to work on visualization in Tableau.
Data Visualization
For this dashboard I am using Tableau Public. A few reminders are important before creating charts with calculated fields:
- The coaches icing data can be used to show counts for icing events at a team or league level, but needs to be divided by 2. As there is a record for every coach, an icing event will be added once to the coach of the icing team, and once to the coach of the iced team. We don’t want to double count.
- A similar situation applies to the player icings, but as there are a changing number of players on the ice for every icing event, it would be a lot harder to use for anything other than player counts than the coaching data.
Storyline
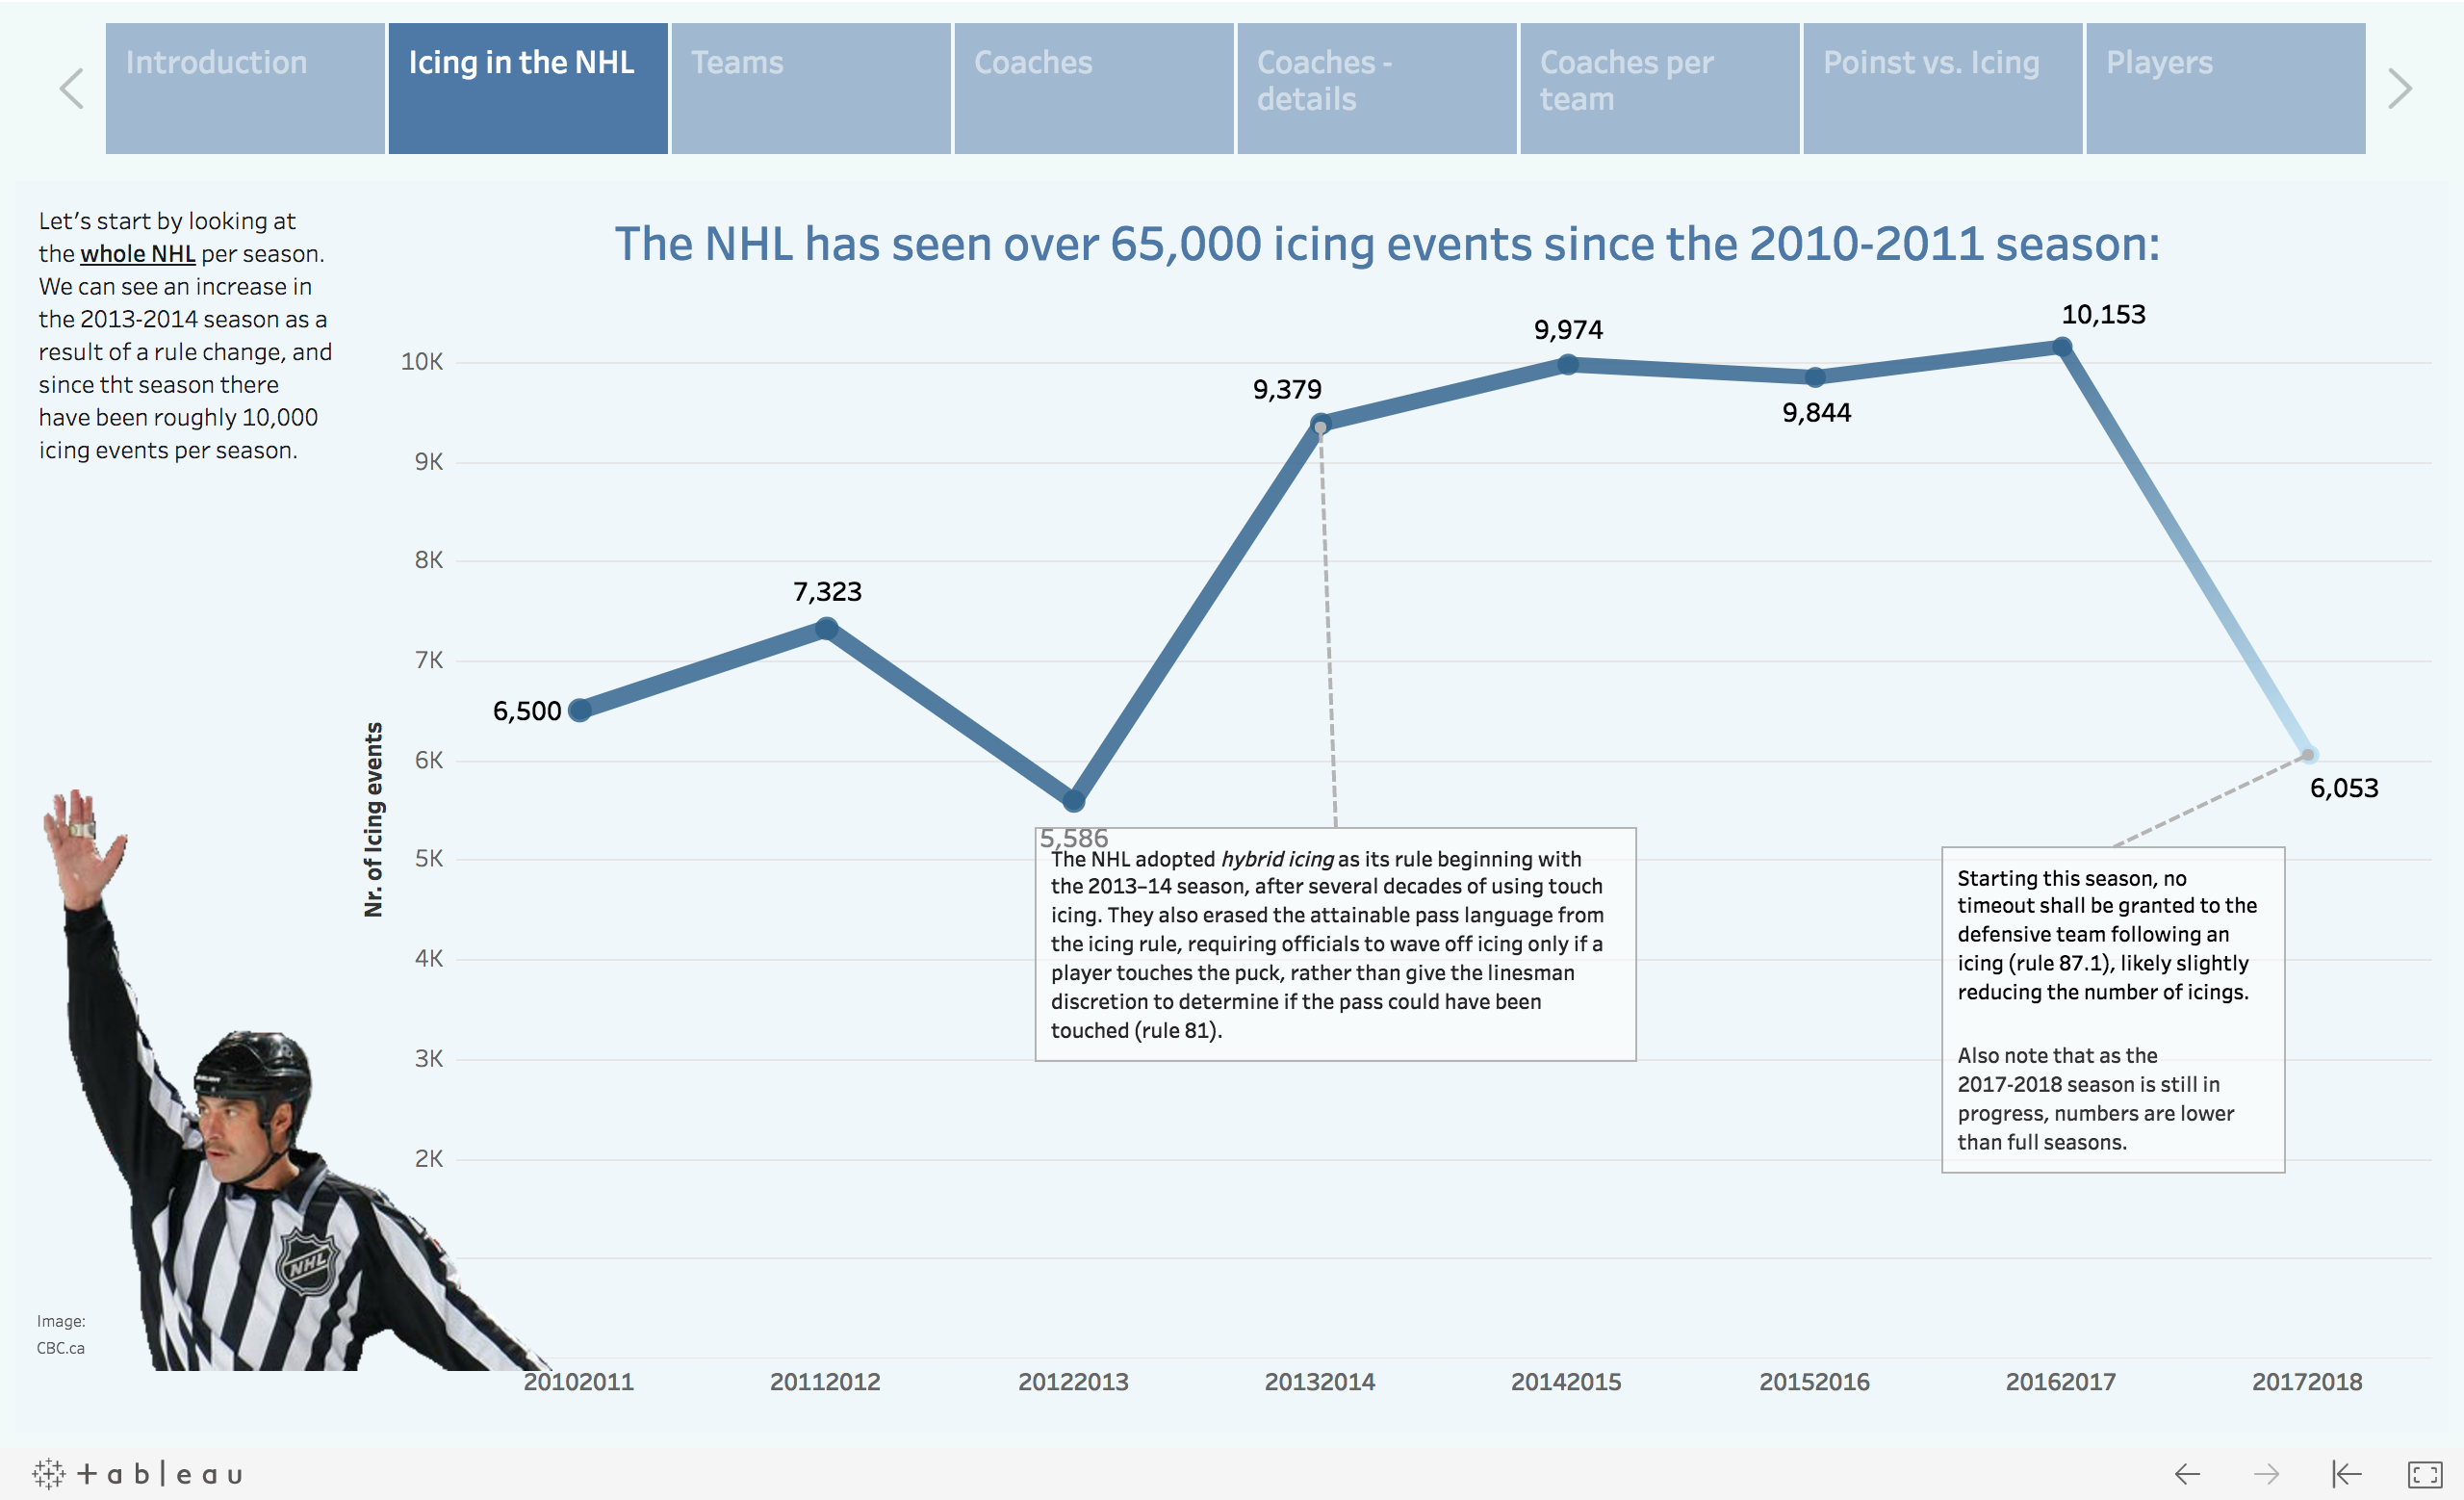
I want to show icing event in context; counts are not particularly interesting as they depend on so many other factors. Icings per game would be more useful, and icing events per team per all icing events in a game, per game would be even more valuable. At a player level showing icing events per 60 min. would add more depth, and this is something I plan looking into at a later stage. One more thing I added is a table of season points per team, based on standings pages at https://www.hockey-reference.com/leagues/NHL_2017_standings.html, which allowes me to look at the relationship (if existing) between a team’s points in a season and the icing ratios and number of icings.
With the data being well prepared the work in Tableau Public was mostly aestetic, only creating a few parameters and calculated fields for an improved user experience. I used the Story feature, which makes the whole dashboard more like a err… story. I hope you enjoy it.
Final result
The story dashboard can be found here I strongly encourage using the full-screen option to get the best experience. If you have any feedback or comments, please connect through Twitter: @rjweise
Some screenshots
